
phpstudy
在PHP扩展中安装Xdebug,修改php.ini中xdebug的相关配置为
[Xdebug]
zend_extension=D:/dev/envs/phpstudy/phpstudy_pro/Extensions/php/php7.3.4nts/ext/php_xdebug.dll
xdebug.collect_params=1
xdebug.collect_return=1
xdebug.auto_trace=On
xdebug.trace_output_dir=D:/dev/envs/phpstudy/phpstudy_pro/Extensions/php_log/php7.3.4nts.xdebug.trace
xdebug.profiler_enable=On
xdebug.profiler_output_dir=D:/dev/envs/phpstudy/phpstudy_pro/Extensions/php_log/php7.3.4nts.xdebug.profiler
xdebug.remote_enable=On
xdebug.remote_host=localhost
xdebug.remote_port=49673
xdebug.remote_handler=dbgp
xdebug.idekey=PHPSTORM
需要注意的是 idekey 和 remote_port
Chrome 插件
这里选择Xdebug Helper by JetBrains
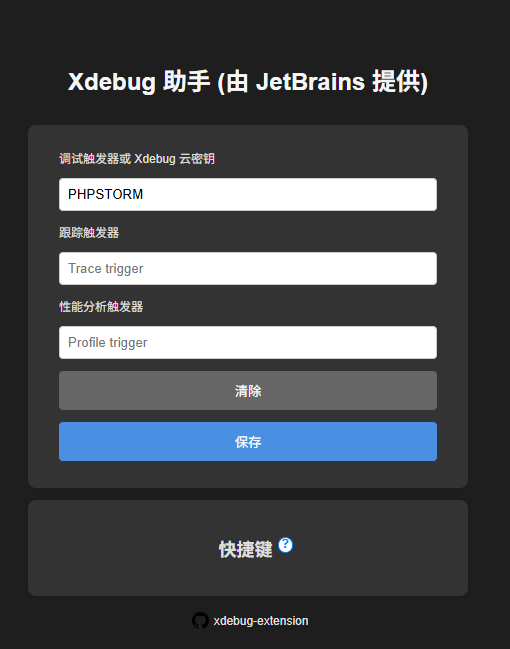
将调试触发器修改为 PHPSTORM
PHPSTORM
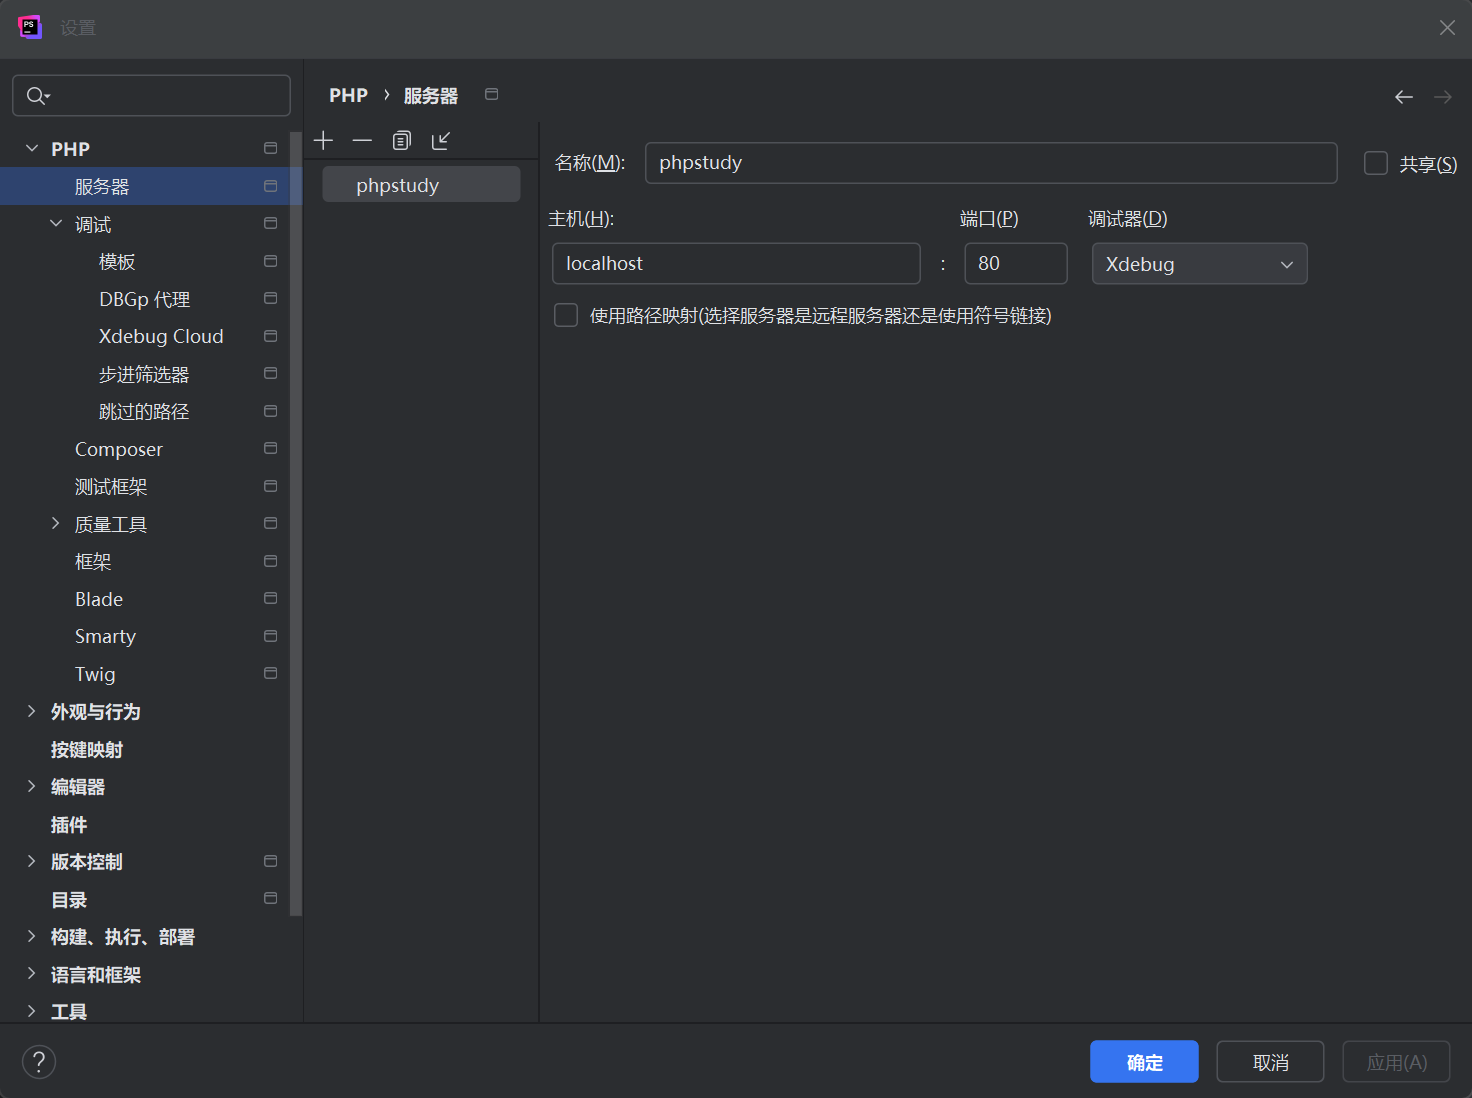
设置-PHP-服务器
调试-DBGp代理
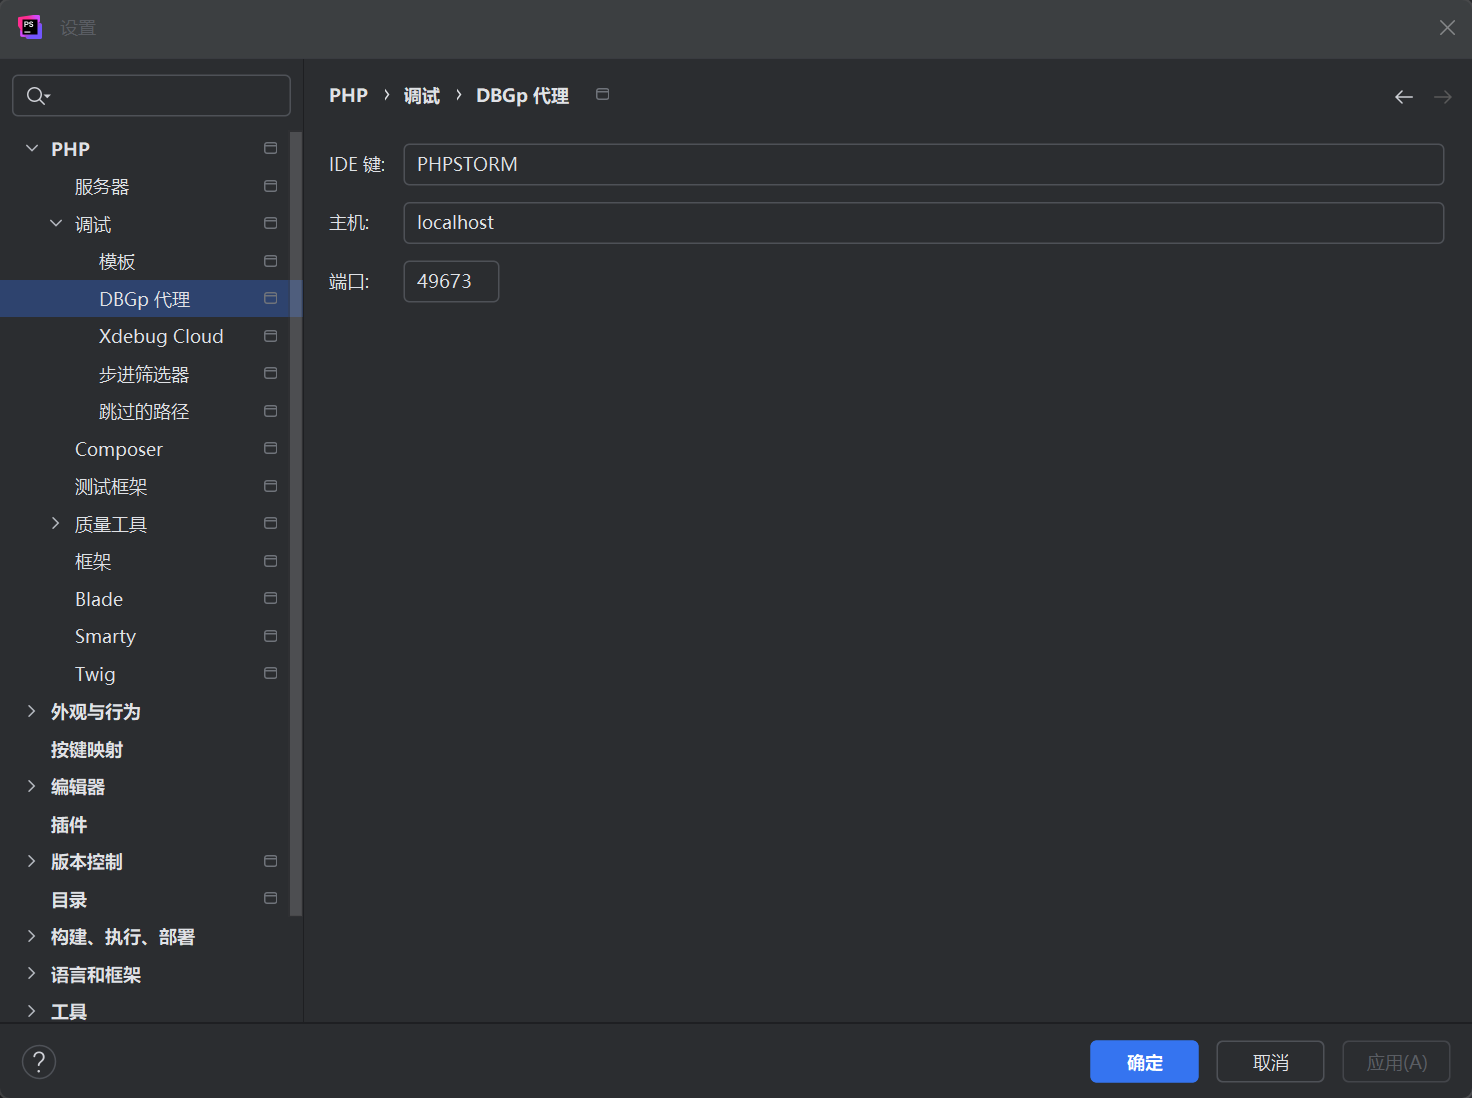
这里的端口要和php.ini中的一致
调试
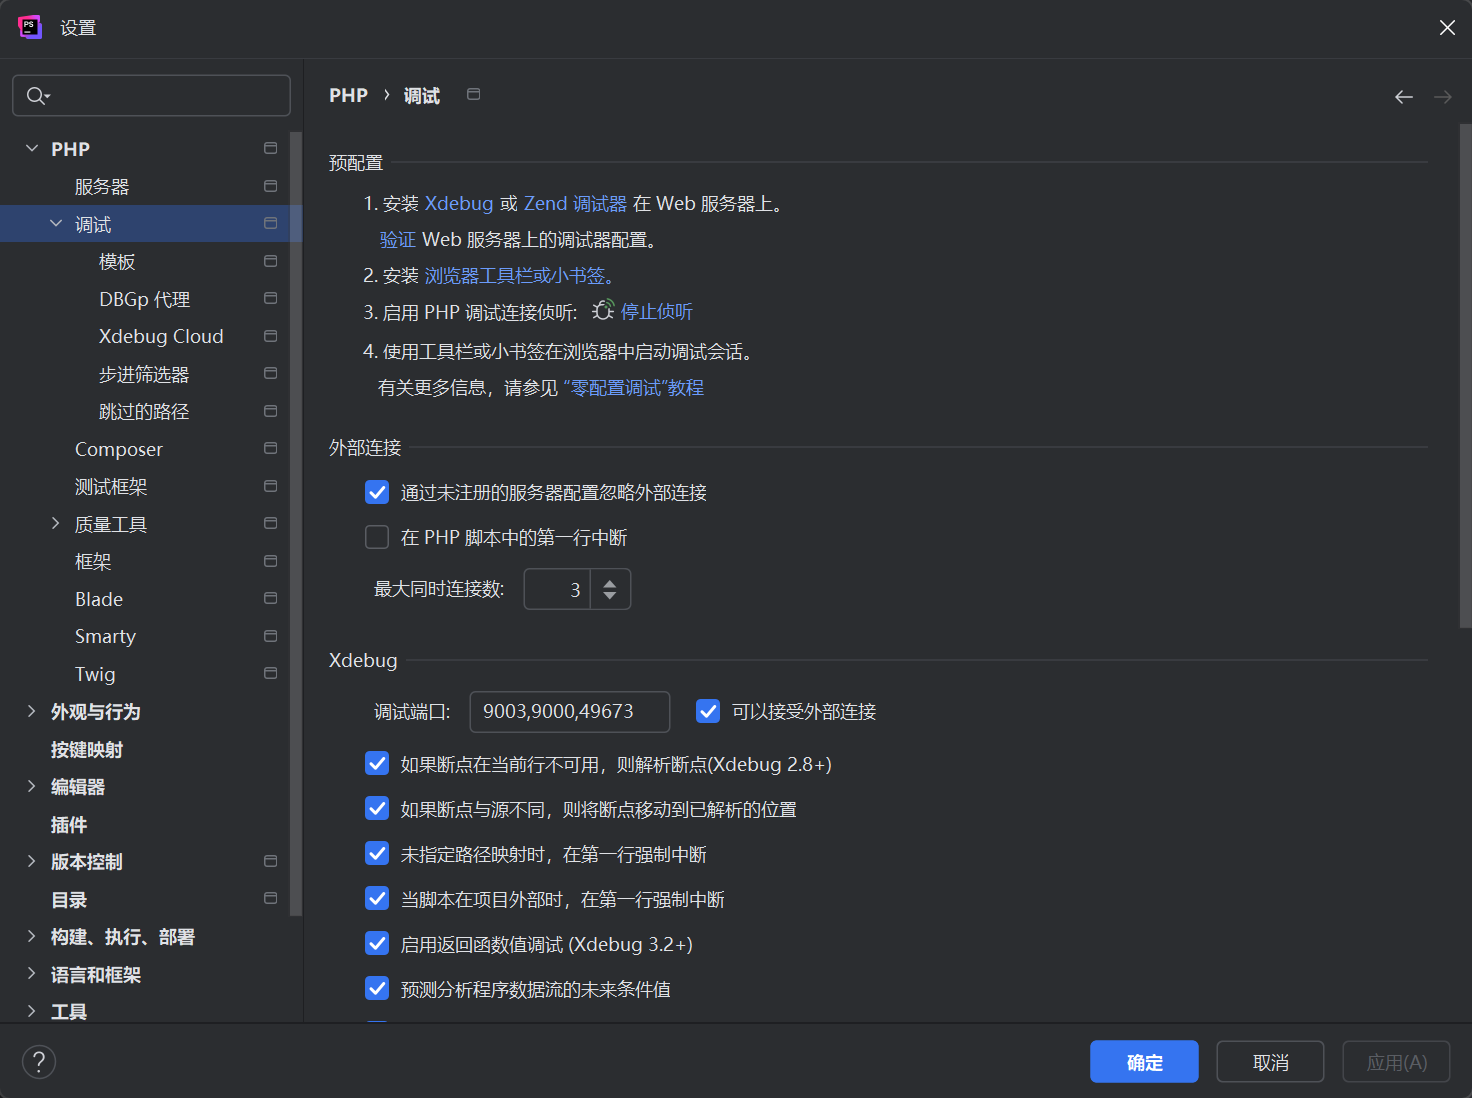
xdebug的调试端口需要包含php.ini中指定的端口
示例
打开phpstudy的网站根目录,开启侦听,在debug.php中下断点,在浏览器中访问相应php文件。
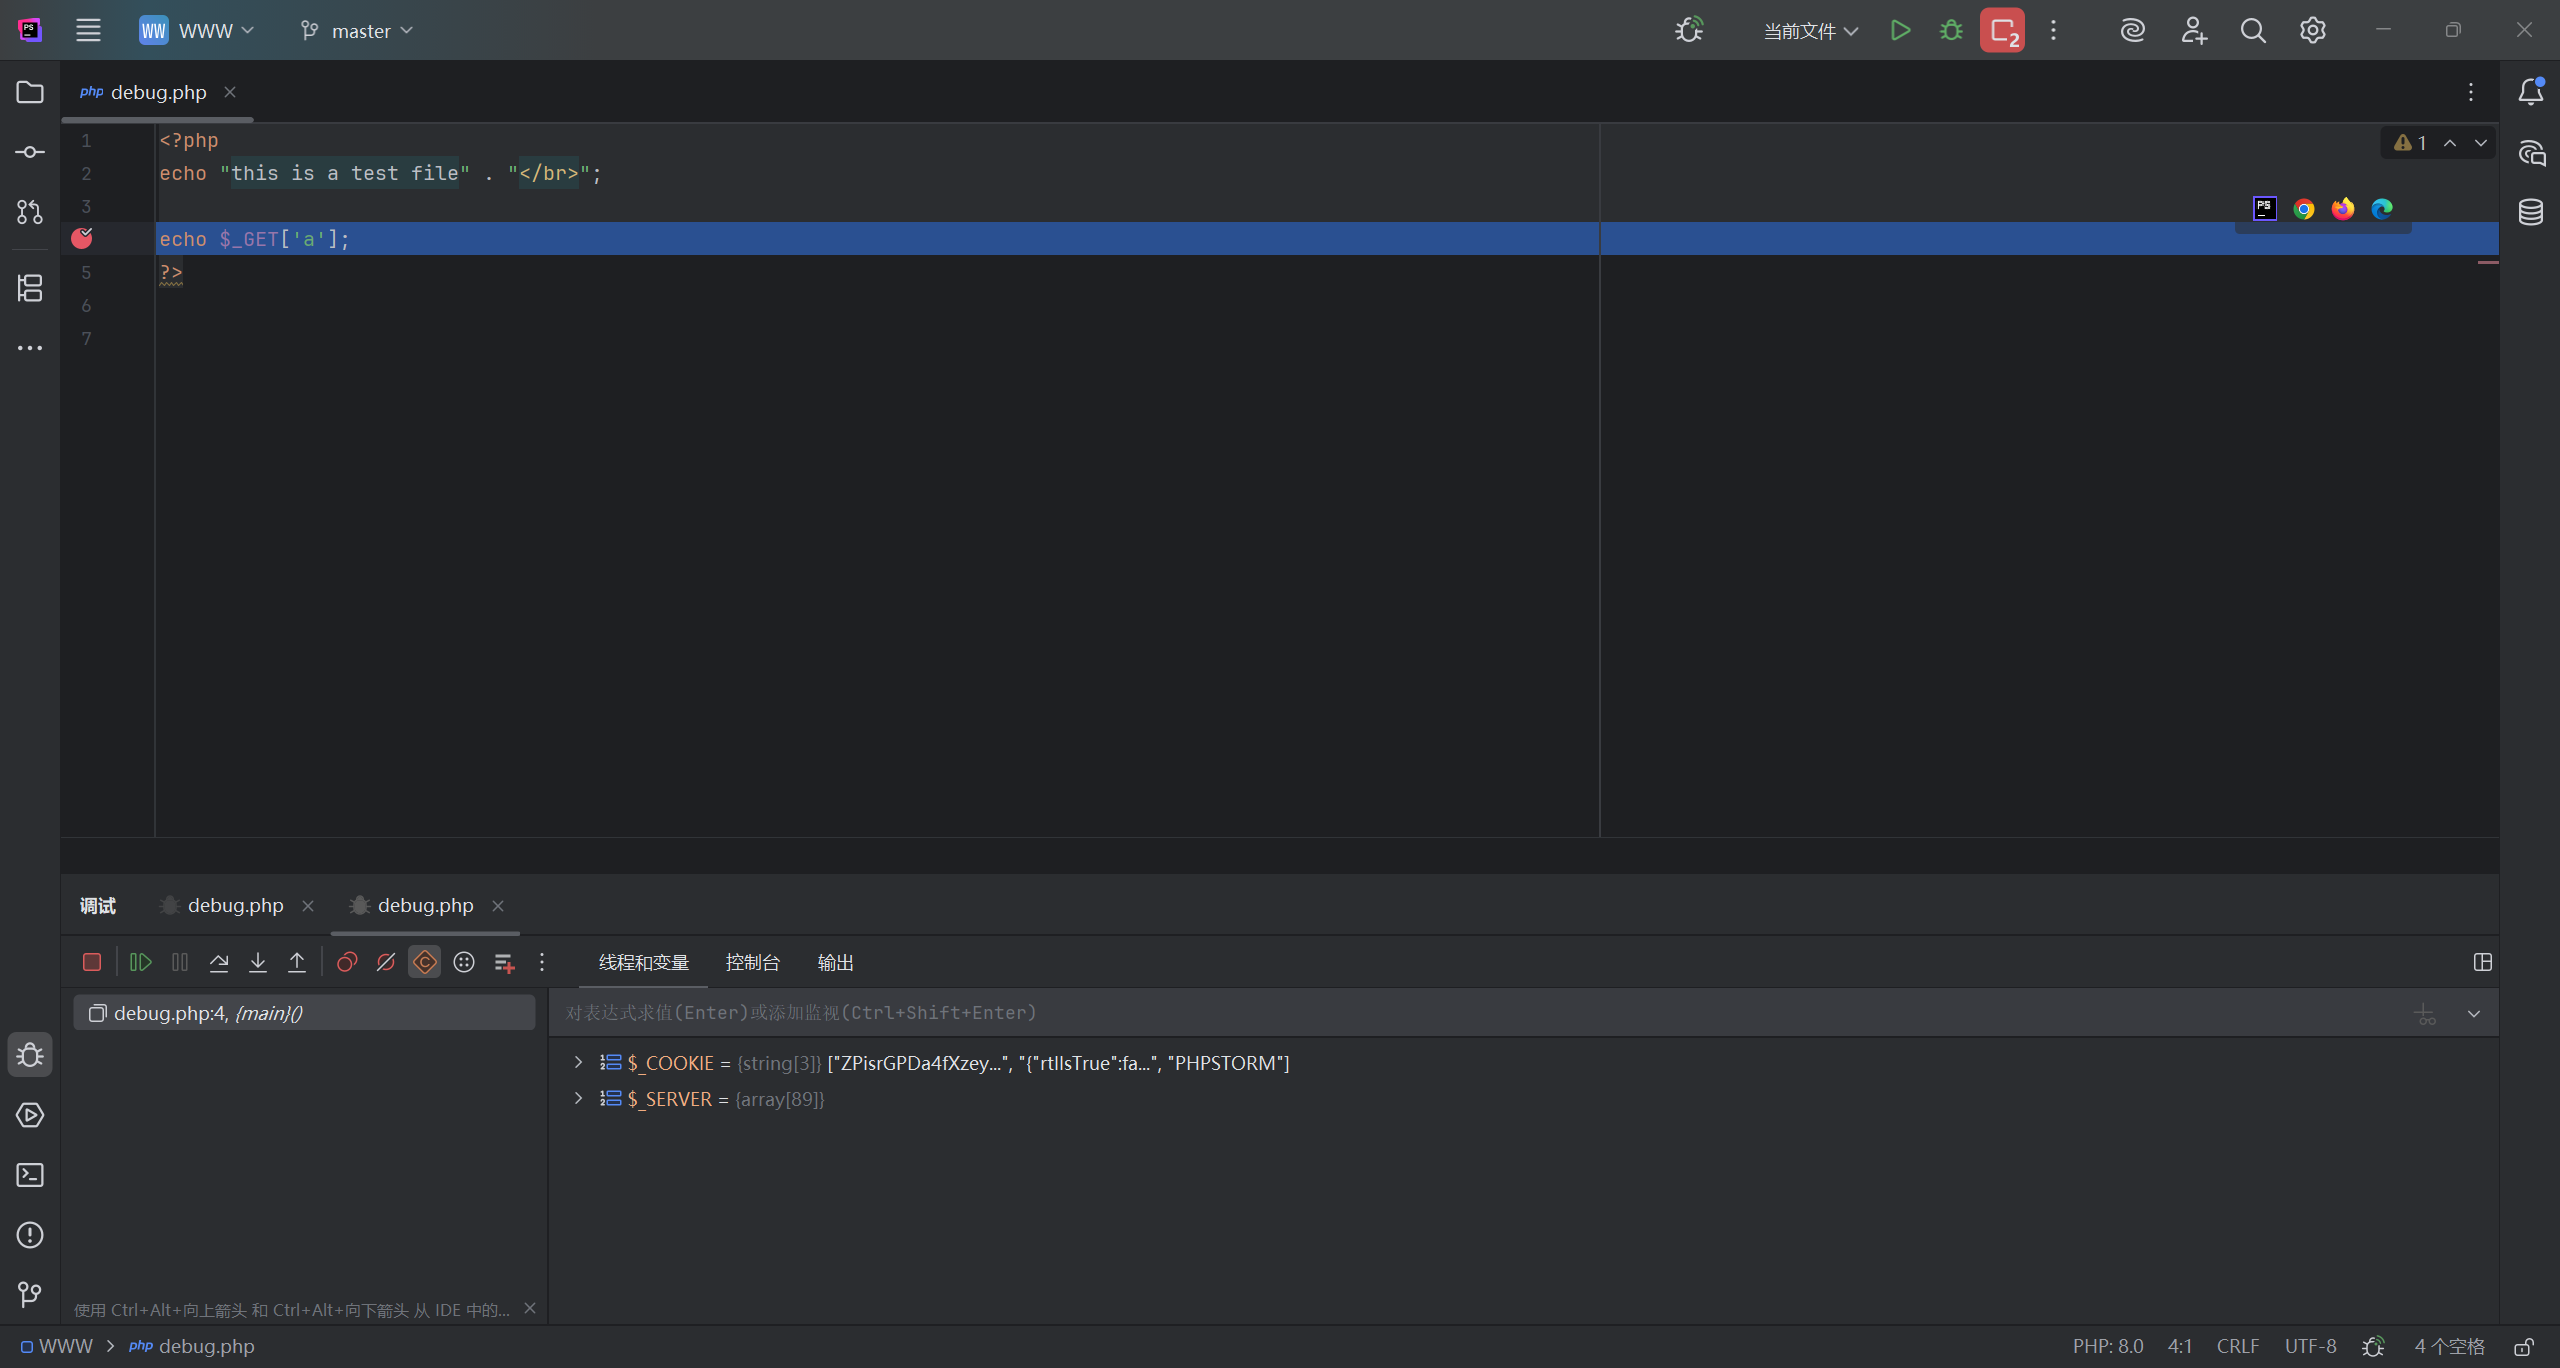
成功调试。
评论